Is the development speed slow, or is what you are making bad?

Preface: Can rails stats measure company value?
rails stats is a handy command to get statistics about the Rails repository, and you can do the same in Laravel with php artisan stats using Laravel Stats.
It's a command to strip the repository's inner workings bare. The size of the models and controllers gives you the size of your app, and the ratio of code to tests tells you if your tests are well written.
The business value of a web service is determined in large part by sales and growth rate, and in smaller detail by business type, whether it is toB or toC, which industry it is for, the number of active users, and so on. On the other hand, it is also said that the growth rate of sales after an IPO is proportional to the number of employees, and once the business scheme has been decided, it can be said that the rest is proportional to the number of employees.
With the increase in the number of companies that measure development productivity indicators such as Four Keys, it seems that the method of maximizing the number of PRs and the amount of code when the number of engineers is invested has become more or less fixed. Then I think the bottleneck will now be whether you are not fighting in a place where it is hard to make money and the strike rate of the PM's measures.
rails stats similar statistics may be publicly available on company blogs, conference presentations, etc, I thought it might be useful to collect and compare publicly available information to visualize how much money other companies are making with this amount of code.
rails stats
For reference, the rails stats for Redmine are as follows
+----------------------+--------+--------+---------+---------+-----+-------+
| Name                 |  Lines |    LOC | Classes | Methods | M/C | LOC/M |
+----------------------+--------+--------+---------+---------+-----+-------+
| Controllers          |   8830 |   6600 |      55 |     534 |   9 |    10 |
| Helpers              |   6740 |   4932 |       1 |     396 | 396 |    10 |
| Jobs                 |    112 |     88 |       3 |       9 |   3 |     7 |
| Models               |  19512 |  14119 |     102 |    1502 |  14 |     7 |
| Libraries            |  20325 |  14490 |     149 |    1176 |   7 |    10 |
| Controller tests     |      0 |      0 |       0 |       0 |   0 |     0 |
| Helper tests         |   4121 |   3198 |      21 |     282 |  13 |     9 |
| Model tests          |      0 |      0 |       0 |       0 |   0 |     0 |
| Mailer tests         |      0 |      0 |       0 |       0 |   0 |     0 |
| Integration tests    |  10344 |   7263 |     101 |     575 |   5 |    10 |
| System tests         |   1504 |   1022 |      10 |      65 |   6 |    13 |
+----------------------+--------+--------+---------+---------+-----+-------+
| Total                |  71488 |  51712 |     442 |    4539 |  10 |     9 |
+----------------------+--------+--------+---------+---------+-----+-------+
  Code LOC: 40229     Test LOC: 11483     Code to Test Ratio: 1:0.3
Vertical axis is type, horizontal axis is index. it is surprising that there is no Controller/Model/Mailer test.
The Code LOC of Basecamp 2012 is 13146, which is larger than the Code LOC of DHH's product (probably HEY). is 0.7, so 0.3 seems like a small test.
Lines are the number of raw lines. LOC is lines without comment and new lines. M/C is Method Per Class and LOC/M is LOC Per Method. Rubocop Metrics/MethodLength default is max 10. But most companies set higher value. Redmine has an average of 9.
After Zeitwerk, 1 class = 1 file. But even before Zeitwerk, it is common to be 1 class = 1 file. The number of tables is about 100 and controllers about 50 if we assume that the number of classes = the number of files.
If I scaffold, the number of methods for controllers would be 7 verb + set_xxx for 8, and the M/C for controllers in Redmine is 9, so +1 or so. Not all controllers need all verbs.
It is hard to say how many methods 14 of Model is without comparing it with other application.
Below is a rails stats comparison.
SmartHR(2022)
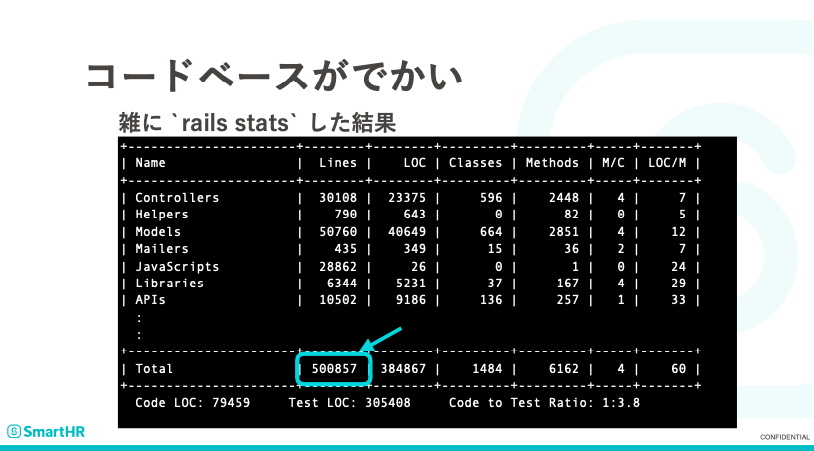
https://speakerdeck.com/sugamasao/smarthr?slide=19
SmartHR is a unicorn company, with an estimated enterprise value of 173.1 billion yen as of September 2022 according to the NEXT Unicorn Survey; as of September 2022, it has 686 employees and 70 engineers.
The Code to Test Ratio is 3.8, which is pretty thickly written test. You have 664 models and 596 controllers, with 1:1 support over Redmine.
I have the impression that the M/C of the controller is 4 and the M/C of the model is 4 and finely filed. The LOC/M is 60, which is a bit large.
freee(2021)

https://speakerdeck.com/mihyaeru21/freee-backend-api?slide=8
I found some statistics on freee, an accounting software company, which is not rails stats, but I add here because similar data is available.
I think it is difficult to compare because freee has multiple products, but the market cap in June 2021 is 559.3 billion, but in June 2022, it is down to 186 billion due to market conditions. Since SmartHR series D is 2021, I think it is fair to compare them as low PSR market condition.
The number of employees in June 2021 is 656.
The number of tables (700) is about the same or a little more than SmartHR's. The number of Ruby files (10,000) is very large. If the number of files = the number of classes, it would be 6.7 times the number of SmartHR.
If we assume that the number of routes is the same as the number of methods in the controller, then the number of routings seems to be twice as large as SmartHR's.
Kanmu(2022)
Kanmu, operator of prepaid bundled cards, acquired by MUFG in December 2022. Reportedly, the valuation is 25 billion yen.
M&A is said to have a lower valuation than IPO, but since sales in 2021 are said to be 3.9 billion yen. I feel it is not that bad when factoring in a SaaS-type PSR of about 5.5x in 2023/04. I'll use it as is for now.
There are 43 employees and 5.5 engineers for bundled cards alone.
According to technology blog, as of 2022/03
- Number of tables: 310+47 = 357
- Number of API endpoints: 121+6=127
I thought the competitiveness of payment systems was in the data handling part, and that domain modeling would be less than pure SaaS, but there are quite a few tables.
Cookpad(2015)

https://speakerdeck.com/a_matsuda/the-recipe-for-the-worlds-largest-rails-monolith?slide=26
Cookpad, a recipe sharing company; its market capitalization peaked in December 2015 at 277.1 billion yen, the peak in the company's history. Although not the subject of this report, the market capitalization has been declining since the following year in January 2016 when there was a internal strife. The number of employees is 519 on a consolidated basis, excluding temporary employees.
LOC/M is 21, which gives the impression that it is relatively low. If we add up the LOC of the code section, the Code to Test Ratio would be 2.1 since it is 140,206.
Cookpad(2017)

https://speakerdeck.com/hogelog/kutukupatudofalseju-da-rails-apurikesiyonfalsegai-shan?slide=16
Cookpad two years later has market capitalization of 65.2 billion yen in December 2017. The number of employees is 389 on a consolidated basis, excluding temporary employees.
The number of models is 1892, an increase of 160 in 2 years. The number of non-consolidated employees is 280 and 1/3 of them are 93 engineers (including mobile and others), so the total number of engineers has increased by 1 table/year per person.
The number of controller classes has increased by 101 in 2 years. The number of methods increased by 564.
Code to Test Ratio decreased by 1.4. It is not always true that more is better. There is an idea that MECE, or cleanly written code reduces the number of tests.
The LOC/M is 20, which indicates that the developers are developing with moderation.
Comparing the number of tables and market capitalization
Now that we have some data, let's compare them under the loose assumption that the number of model classes = the number of tables.
 .
.
It doesn't work very well (tears). External factors are significant.
Let's try freee(2021) with 2022 value as PSR was too high, and Cookpad's original corporate value before the strife.

I feel like I looked at it the way I wanted to look at it, but this is Number of tables*1.5+345=Market capitalization (JPY billion). If we remove the intercept for a more rough understanding, the benchmark for a listed company would be Each additional table in the RDB raises the market capitalization by 200 million yen.
Since I also checked the number of employees, let's compare it with the number of tables.

It doesn't work. If we correct it in the same way...

No good. The total number of tables works by integrating the number of employees to date x number of years, so the current number of employees is not that meaningful when compared to a startup with explosive growth.
Thoughts
I didn't gather as many Rails stats as I expected, so I was wondering if there are any other companies that publish them.
There are several open source web services for Rails, so I would like to compare them as well.